How I Built a CvR Dashboard to Answer the Dreaded "What's the SEO Impact?" Question

Connecting the Dots: How mapping organic search traffic to conversion rates unlocks the true financial impact of SEO.
If you work in search engine optimization, you know the feeling. You enter a meeting with product managers, developers, and finance leads with a list of technical fixes. You talk about organic traffic growth, crawl budget optimization, or indexing. You finish, and then your manager or the CFO asks: “What will the actual business impact of this SEO change be?”
You freeze. You talk about search volumes, impressions, or ranking increases. But you can see their eyes glaze over. They do not care about ranking position 3 versus position 5. They want to know the direct financial returns. They want to know if the engineering hours spent on your project will pay off in dollars.
For many of us, trying to calculate SEO revenue impact felt like guessing. Because search traffic has many variables, showing a direct connection to sales was difficult. But when I joined Eventbrite as an SEO insights manager, I found a perfect solution. Once I saw my manager(João Filipe Pereira) calculating how much revenue we can generate from a simple routine SEO change, and I realized that if we could link our organic search performance to page-level conversion metrics, we could build highly accurate forecast models.
I thought I can build this, so I built a custom SEO conversion rate dashboard in Tableau. By connecting our Sessions Data with Orders data to our reporting views, I was able to track the exact conversion rate of our search traffic. This dashboard did not just only added one more view, it changed the way we prioritized projects and secured engineering resources.
In this guide, I will show you exactly how I built this system, and how you can use this methodology to prove search value to your own leadership team.
The Battle for Engineering Resources in SaaS SEO
Why Product Enhancements Always Beat Standard SEO Requests
When you work at an agency or on a simple content site, you often have direct control over your pages. You write the copy, get images, and make changes. But when you move to a SaaS company, the operational environment is completely different. It was difficult to explain this to someone I recently connected for a discussion, who has only worked in agencies with non-SaaS clients. In SaaS companies SEO Team do not own the website codebase. The engineers work for the product team, and their time is highly guarded.

The SaaS Prioritization Dilemma: Why standard SEO traffic requests struggle to compete against revenue-driving product features in the sprint queue.
At Eventbrite, which is a SaaS company, we had millions of programmatically generated event pages and directories, which means engineering resources seems always limited. Every time we needed a technical change, like updating structured data schemas or fixing crawl pathways, we had to create a PRD, connect with project managers, show impact on revenue and submit a ticket to the engineering queue.
The problem was that the engineers were always busy. They were focused on product enhancements, checkout page optimizations, and features designed to make registration faster. The managers overseeing those sprints were protective of their developers’ hours. If I need a developer to spend three days cleaning up technical errors, the question arises: “What is the opportunity cost? How does this aligns with our product roadmap?”
If you cannot answer that question with a clear financial figure, your request will lose. Every single time. Product enhancements have clear, estimated transaction improvements. To compete for development sprints, you must show that your search optimization requests have an equal or greater business value.
The Leadership Dilemma: Proving Financial Value Over Search Volume
The struggle for engineering resources is part of a larger leadership challenge. The executive suite does not think in terms of keyword rankings or index status. They think in terms of annual revenue, customer acquisition cost, and gross profit.
When they ask to perform an SEO impact analysis for a project, they were not looking for a list of target search volumes. They had a dilemma: they needed to decide how to allocate a limited budget and headcount.
If I presented a proposal saying: “This project will increase our organic search impressions by 20% over six months,” the manager had no way to compare that against other department requests. Does a 20% increase in impressions mean ten new transactions or ten thousand?
This gap in understanding is why many enterprise search projects are delayed or cancelled. If you do not tie your metrics to revenue, leadership will view search engine optimization as a branding expense rather than a growth engine. To establish search as a core business driver, you must show the financial return on investment.
The Solution: Linking Page Group Conversion Rates (CvR) to Revenue
Why All Traffic is Not Created Equal: The Power of Page Groups
The key to unlocking accurate financial forecasts is understanding that website traffic does not convert at a single, sitewide rate. If you apply a generic website conversion rate to your search traffic, your forecasts will be wildly inaccurate.
All traffic is not created equal. The intent of a visitor changes based on the page they land on. For example, if a user searches for “how to host a local charity run” and lands on one of our resource articles, they are looking for information. They are in the early stages of planning. They might read the article, download a checklist, and leave. Their immediate conversion rate is very low.
But if a user searches for “buy tickets to charity run in New York City” and lands on a local event directory, their intent is transactional. They have their credit card ready. The conversion rate for this page is going to be significantly higher.
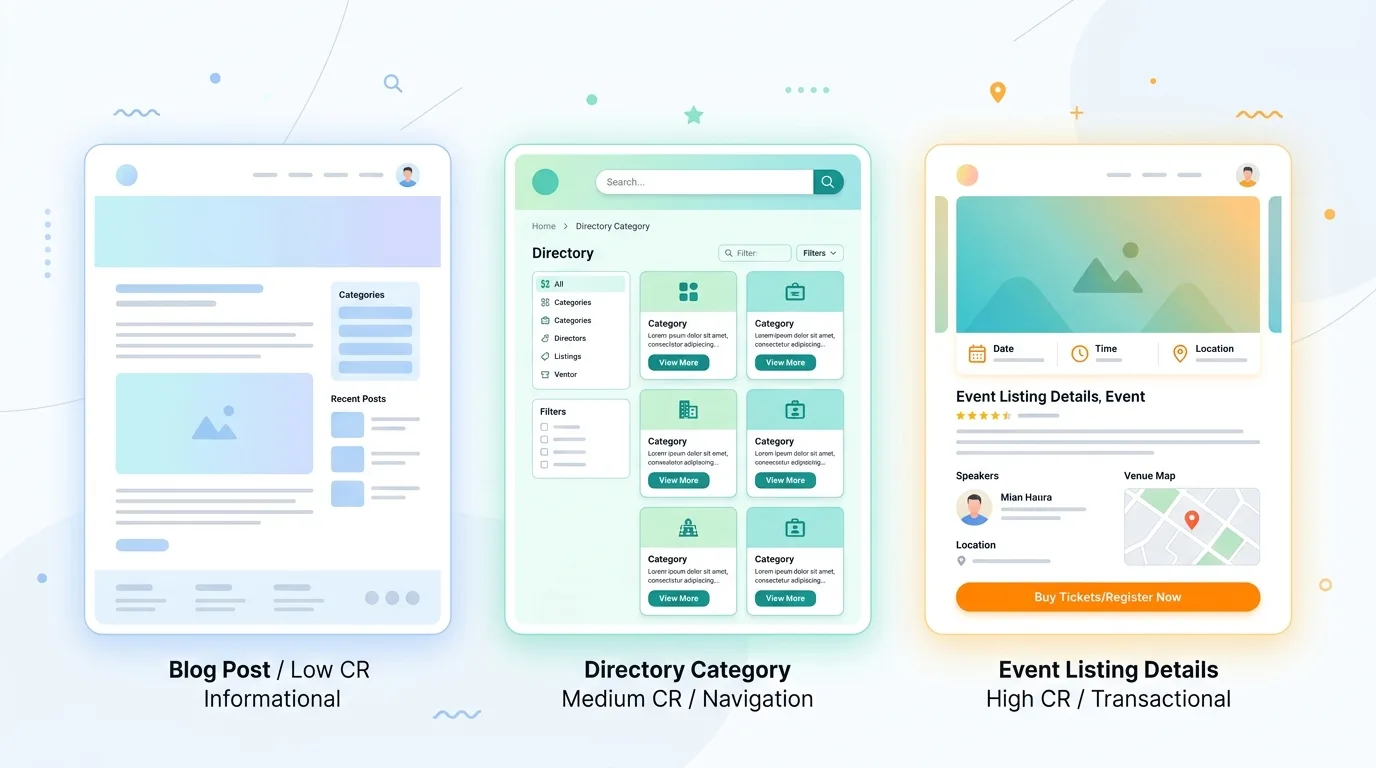
To build a reliable model, you must divide your site into distinct page groups based on user intent and template structure. At Eventbrite, we categorized our pages into three primary groups:
- Event Listing Pages: The individual, user-created pages for specific events.
- Discovery Pages: The curated city and category directories (e.g., music festivals in Austin).
- Editorial Blogs: Informational guides and articles focused on event planning.
By measuring the unique page group conversion rate for each segment, we were able to run precise financial models.
Aligning SEO Projects with Annual Corporate Goals
Once you have calculated the unique conversion rate for each page group, you can prioritize your tasks based on the company’s annual goals.
Every year, SaaS companies set strategic targets. One year, the focus might be on maximizing transaction volume and ticket sales. The next year, the goal might shift to merchant acquisition, signing up new event organizers (creators) to host events on the platform.
Your prioritization model must adjust to these changes. If the company is focusing on creator acquisition, then a project that improves traffic to our editorial blog templates (where event creators look for advice) becomes highly valuable. Even if our consumer-facing discovery pages get more raw traffic, the corporate focus makes creator page growth the priority.
Having a segmented model allows you to target your optimization efforts. You can show leadership that your search projects are not just driving random traffic, but are actively helping the company meet its core yearly targets.
Inside the Tableau CvR Dashboard I Built at Eventbrite
To put this methodology into practice, I built a self-serve SEO conversion rate dashboard in Tableau. We already had sessions dashboard and Orders dashboard separately, I just merged both dashboard.

Key Metrics: Tracking Paid, Free, and Total Transactions
The dashboard was designed to track several core metrics across each page segment:
- Sessions: The total number of organic search visits to a specific page group.
- Total Orders: The sum of all completed ticket purchases.
- Paid Orders: The number of purchases for paid events, which directly generate ticket fees.
- Free Orders: Registrations for free events, which are vital for expanding our active user base.
- Page Group Conversion Rate (CvR): The percentage of sessions that resulted in a transaction, calculated using the formula below.
Conversion Rate (CvR) = (Total Transactions / Sessions) * 100By displaying these metrics on a weekly, monthly, and quarterly timeline, we could spot conversion trends and see which page groups were driving the most commercial value.
Niche Analysis Using Filters: TLDs, Devices, and Cities
To make the dashboard useful for regional analysis, I added several interactive filters. These controls allowed us to run granular analyses:
- TLD (Top-Level Domain): We could filter the data by country extensions (such as .com, .co.uk, or .ca) to monitor regional market health.
- Device: Filtering performance by desktop, mobile, or tablet to isolate user experience issues.
- City: Segmenting traffic and conversions by specific metropolitan areas (e.g., New York City, Chicago, London).
For example, if we noticed a sudden drop in conversion rate on our mobile listing pages in London, we could immediately run a technical audit on that specific page group and device combination. This level of detail turned our dashboard from a simple reporting tool into an active troubleshooting asset.
Put into Action: Two Real-World Forecasting Examples
Let’s look at two examples showing how we used the dashboard metrics to calculate the financial impact of search initiatives.
Example 1: Estimating the Dollar Value of 10,000 New Local Discovery Pages
Suppose the product team wants to launch 10,000 new local discovery pages targeting specific neighborhood event categories in New York City. The engineering manager asks: “What is the expected revenue return for this deployment?”
First, we filter our Tableau dashboard to find the historical performance of similar NYC Discovery Pages:
- Average organic traffic per page: 10 sessions per month
- Target Page Group: Discovery Pages
- Historical NYC Discovery Page Conversion Rate (CvR): 2.5%
- Average ticket price: $40
- Average Gross Ticket Fee (GTF) revenue collected per transaction: $3.00
Note: All the numbers shown above are not real, these are assumed for example purpose only.
We calculate the estimated return using the following formula :
Expected Revenue = (Number of Pages * Sessions per Page) * Page Group CvR * Revenue per Transaction
Let’s do the arithmetic:
- Expected Monthly Traffic:
10,000 pages * 10 sessions/page = 100,000 organic sessions per month - Estimated Monthly Transactions:
100,000 sessions * 2.5% CvR = 2,500 ticket transactions - Estimated Monthly Revenue (GTF):
2,500 transactions * $3.00 fee = $7,500 per month - Annualized Revenue Impact:
$7,500 * 12 months = $90,000 in annual revenue
By presenting the project as a $90,000 annual revenue opportunity rather than a request for “better page coverage,” we secured the engineering resources needed for the launch.
Example 2: Forecasting Creator Acquisition from 100 Template-Driven Blogs
Now, let’s look at a creator acquisition campaign. The marketing team plans to publish 100 template-driven blogs targeting event organizers (creators) looking for event planning templates. The corporate goal this year is maximizing creator sign-ups.
We filtered our Tableau dashboard to find the benchmarks for the Editorial Blog page group:
- Expected organic traffic per blog: 500 sessions per month
- Target Page Group: Editorial Blogs
- Historical Creator Sign-up Conversion Rate (CvR): 1.2%
- Creator Activation Rate (creators who successfully publish a paid event): 20%
- Average annual revenue generated per active creator: $1,500
Note: All the numbers shown above are not real, these are assumed for example purpose only.
We calculate the forecast using the following formula:
Annual Creator Value = (Blogs * Traffic per Blog) * Sign-up CvR * Activation Rate * Annual Creator Revenue
Let’s break down the arithmetic:
- Expected Monthly Traffic:
100 blogs * 500 sessions = 50,000 organic sessions per month - Expected Creator Sign-ups:
50,000 sessions * 1.2% CvR = 600 creator sign-ups per month - Active Creator Acquisitions:
600 sign-ups * 20% activation rate = 120 active publishing creators per month - Annualized Creator Portfolio Value:
120 active creators * $1,500 value = $180,000 in annual value
By connecting this content campaign to creator sign-ups and revenue, we aligned the project directly with the company’s yearly goals, securing executive approval.
Stop pitching search engine optimization using vanity metrics. If you want to secure budget, get engineering priority, and build credibility, you must translate organic performance into financial value.
Building a conversion rate dashboard allows you to connect search metrics to business revenue. You can stop guessing about traffic increases and start estimating exact revenue returns.
If you are trying to build an impact dashboard for your organization, or if you need help setting up page grouping in Tableau or Snowflake, let’s connect. Find me on LinkedIn – I am always happy to share my templates and help you prove the financial value of your search programs.

Vishal Gupta
SEO & Digital marketing Leader. Talks about how to turn data into actionable insights and SEO / AEO automations.